TensorFlow Tutorial 1 - Classify Images
はじめに
機械学習(ML)の環境を整えた.
導入したDocker環境で画像分類のチュートリアルをベースに一連の流れをトレースする.
ちなみにもとのコード類はMITライセンスとなっている.
#@title MIT License
#
# Copyright (c) 2017 François Chollet
#
# Permission is hereby granted, free of charge, to any person obtaining a
# copy of this software and associated documentation files (the "Software"),
# to deal in the Software without restriction, including without limitation
# the rights to use, copy, modify, merge, publish, distribute, sublicense,
# and/or sell copies of the Software, and to permit persons to whom the
# Software is furnished to do so, subject to the following conditions:
#
# The above copyright notice and this permission notice shall be included in
# all copies or substantial portions of the Software.
#
# THE SOFTWARE IS PROVIDED "AS IS", WITHOUT WARRANTY OF ANY KIND, EXPRESS OR
# IMPLIED, INCLUDING BUT NOT LIMITED TO THE WARRANTIES OF MERCHANTABILITY,
# FITNESS FOR A PARTICULAR PURPOSE AND NONINFRINGEMENT. IN NO EVENT SHALL
# THE AUTHORS OR COPYRIGHT HOLDERS BE LIABLE FOR ANY CLAIM, DAMAGES OR OTHER
# LIABILITY, WHETHER IN AN ACTION OF CONTRACT, TORT OR OTHERWISE, ARISING
# FROM, OUT OF OR IN CONNECTION WITH THE SOFTWARE OR THE USE OR OTHER
# DEALINGS IN THE SOFTWARE.
機械学習を使うために,まずは人間が機械学習について学習しなければならない. 今回の目的はMLを理解することではなく,あくまでTensorFlowの使い方について私自身が学習することにある.
人工ニューロンや機械学習の仕組みについての詳細には触れない.
もっとも私はMLやDLの専門家ではない.全くの門外漢である.
今回利用するライブラリKerasのドキュメントを読むことでも処理過程の理解が深まるだろう.
ML環境準備
RUN CONTAINER
$ docker run -v /path/to/locas/directory/to/mount/:/mnt --runtime=nvidia -it tensorflow/tensorflow:latest-gpu bash
コンテナを立ち上げる.
dockerコマンドはデフォルトではroot権限で実行する必要があるが,いちいちsudoするのは面倒なので適当に設定しておいた.
また.諸々の成果物をローカルに移動できるように適当なディレクトリをマウントしておく.
ここからはDocker内の操作に移る.
SETUP ML ENV
[root Docker]# apt-get update
[root Docker]# apt-get install -y python-matplotlib xvfb
[root Docker]# xvfb-run -a python
グラフ描画ライブラリと仮想的なGUI環境をインストールする. グラフ描画ライブラリの利用にはDISPLAYが必要らしく仮想的なGUI環境が必要になる.
仮想GUI環境でインタラクティブなPythonを起動する.
ここからはDocker内のインタラクティブなPython内での操作に移る.
CHECK TensorFlow VERSION
from __future__ import absolute_import, division, print_function

# TensorFlow and tf.keras
import tensorflow as tf
from tensorflow import keras

# Helper libraries
import numpy as np
import matplotlib.pyplot as plt

print(tf.__version__)
2.0.0-alpha0
バージョンが2.0アルファであることがわかる.
IMPORT MNIST DATASET
fashion_mnist = keras.datasets.fashion_mnist
(train_images, train_labels), (test_images, test_labels) = fashion_mnist.load_data()
Downloading data from https://storage.googleapis.com/tensorflow/tf-keras-datasets/train-labels-idx1-ubyte.gz
32768/29515 [=================================] - 0s 0us/step
40960/29515 [=========================================] - 0s 0us/step
Downloading data from https://storage.googleapis.com/tensorflow/tf-keras-datasets/train-images-idx3-ubyte.gz
26427392/26421880 [==============================] - 3s 0us/step
26435584/26421880 [==============================] - 3s 0us/step
Downloading data from https://storage.googleapis.com/tensorflow/tf-keras-datasets/t10k-labels-idx1-ubyte.gz
16384/5148 [===============================================================================================] - 0s 0us/step
Downloading data from https://storage.googleapis.com/tensorflow/tf-keras-datasets/t10k-images-idx3-ubyte.gz
4423680/4422102 [==============================] - 0s 0us/step
4431872/4422102 [==============================] - 0s 0us/step
学習用のデータであるMNISTをインポートする. データの中身は服や靴のグレースケール画像の詰め合わせである.
class_names = ['T-shirt/top', 'Trouser', 'Pullover', 'Dress', 'Coat', 'Sandal', 'Shirt', 'Sneaker', 'Bag', 'Ankle boot']
データを分類するクラス名を10個用意する.
データの前処理
CHECK ORIGINAL IMAGE
plt.figure()
plt.imshow(train_images[0])
plt.colorbar()
plt.grid(False)
plt.savefig("/mnt/gray.png")
MNISTのオリジナルデータはグレースケール画像なので,0〜255の数値で構成されている. こんな感じで値が分布している.

NORMALIZATION
train_images = train_images / 255.0
test_images = test_images / 255.0
グレースケールのままではMLに利用できない. MLに使うデータは下準備が必要になる.
0〜255 の数値を 0〜1 にレンジを変える.
CHECK 25 IMAGES WITH CLASS NAME
plt.figure(figsize=(10,10))
for i in range(25):
    plt.subplot(5,5,i+1)
    plt.xticks([])
    plt.yticks([])
    plt.grid(False)
    plt.imshow(train_images[i], cmap=plt.cm.binary)
    plt.xlabel(class_names[train_labels[i]])

plt.savefig("/mnt/check25.png")
各画像とそれに対応するクラス名が正しいか確認する.
グレースケール値は255で除算したので0〜1に変換されたが,plt.cm.binary部分でカラーマップを適用してグレースケールっぽく見せている.

モデル構築
SETUP THE LAYERS
model = keras.Sequential([
    keras.layers.Flatten(input_shape=(28, 28)),
    keras.layers.Dense(128, activation='relu'),
    keras.layers.Dense(10, activation='softmax')
])
keras.layers.Flattenでは 2次元配列(28x28)を1次元配列(784)に変換している.
keras.layers.Denseではニューラルネットワークのレイヤーを構成している.
基本的なニューラルネットワークは木構造のようなレイヤーと呼ばれる形で構成されている.
このチュートリアルでは,1層目は128個のノード(人工ニューロン)で構成し,活性化関数にReLU関数を指定している.
ReLU関数は入力値が0以下の場合は0を返し,入力値が0より大きい場合は入力値をそのまま返す.
2層目は10個のノード(人工ニューロン)で構成し,活性化関数にsoftmax関数を指定している.
softmax関数は出力の総和が1になる性質がある.10個のノードが10個のクラスに,各ノードの値が分類されたクラスである確率に対応する.
COMPILE THE MODEL
model.compile(optimizer='adam', loss='sparse_categorical_crossentropy', metrics=['accuracy'])
機械学習の前にもう少し設定する項目がある.
TRAIN THE MODEL
model.fit(train_images, train_labels, epochs=5)
Epoch 1/5
2019-03-24 04:51:42.828865: I tensorflow/stream_executor/platform/default/dso_loader.cc:42] Successfully opened dynamic library libcublas.so.10.0
60000/60000 [==============================] - 3s 55us/sample - loss: 0.4965 - accuracy: 0.8263
Epoch 2/5
60000/60000 [==============================] - 3s 50us/sample - loss: 0.3751 - accuracy: 0.8650
Epoch 3/5
60000/60000 [==============================] - 3s 50us/sample - loss: 0.3365 - accuracy: 0.8767
Epoch 4/5
60000/60000 [==============================] - 3s 53us/sample - loss: 0.3120 - accuracy: 0.8864
Epoch 5/5
60000/60000 [==============================] - 3s 50us/sample - loss: 0.2950 - accuracy: 0.8916
<tensorflow.python.keras.callbacks.History object at 0x7f4a0c13af10>
5回繰り返して学習して,正確さは89%くらい.
EVALUATE ACCURACY
test_loss, test_acc = model.evaluate(test_images, test_labels)
10000/10000 [==============================] - 0s 34us/sample - loss: 0.3475 - accuracy: 0.8749
テストデータを使って学習精度を確認すると,正確さは87%になった.
学習していない未知のデータに対しては正確さが低下する.これを過剰適合という.
予測
MAKE PREDICTIONS
predictions = model.predict(test_images)
predictions[0]
array([7.5334533e-08, 6.2826060e-09, 3.1865625e-08, 4.0518628e-09,
       1.6207629e-07, 6.2025473e-03, 3.9942460e-08, 3.3911347e-02,
       3.2067274e-07, 9.5988548e-01], dtype=float32)
配列predictionsには,画像がどのクラスに分類されるかの確率が格納されている.このままだとパット見わかりにくいので,最大値の配列番号を取り出す.
np.argmax(predictions[0])
9
最も確率の高い番号がこれ.9番は Ankle boot に対応するので正しく分類されている.
PREDICTIONS TO GRAPH
def plot_image(i, predictions_array, true_label, img):
    predictions_array, true_label, img = predictions_array[i], true_label[i], img[i]
    plt.grid(False)
    plt.xticks([])
    plt.yticks([])
    plt.imshow(img, cmap=plt.cm.binary)
    predicted_label = np.argmax(predictions_array)
    if predicted_label == true_label:
        color = 'blue'
    else:
        color = 'red'
    plt.xlabel("{} {:2.0f}% ({})".format(class_names[predicted_label], 100*np.max(predictions_array), class_names[true_label]), color=color)

def plot_value_array(i, predictions_array, true_label):
    predictions_array, true_label = predictions_array[i], true_label[i]
    plt.grid(False)
    plt.xticks([])
    plt.yticks([])
    thisplot = plt.bar(range(10), predictions_array, color="#777777")
    plt.ylim([0, 1])
    predicted_label = np.argmax(predictions_array)
    thisplot[predicted_label].set_color('red')
    thisplot[true_label].set_color('blue')
グラフ生成などを行う関数を用意する.
i = 0
plt.figure(figsize=(6,3))
plt.subplot(1,2,1)
plot_image(i, predictions, test_labels, test_images)
plt.subplot(1,2,2)
plot_value_array(i, predictions,  test_labels)
plt.savefig("/mnt/0th.png")
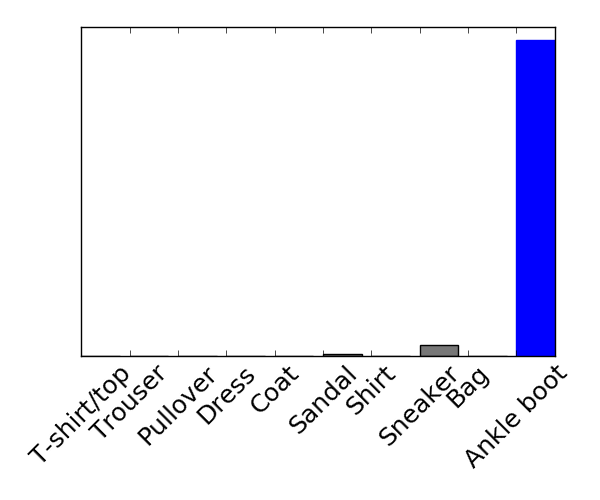
先程のAnkle bootをグラフで確認するとこんな感じ.グラフは定義したクラス名が左から順に並んでいる.
num_rows = 5
num_cols = 3
num_images = num_rows*num_cols
plt.figure(figsize=(2*2*num_cols, 2*num_rows))
for i in range(num_images):
    plt.subplot(num_rows, 2*num_cols, 2*i+1)
    plot_image(i, predictions, test_labels, test_images)
    plt.subplot(num_rows, 2*num_cols, 2*i+2)
    plot_value_array(i, predictions, test_labels)

plt.savefig("/mnt/predictions.png")
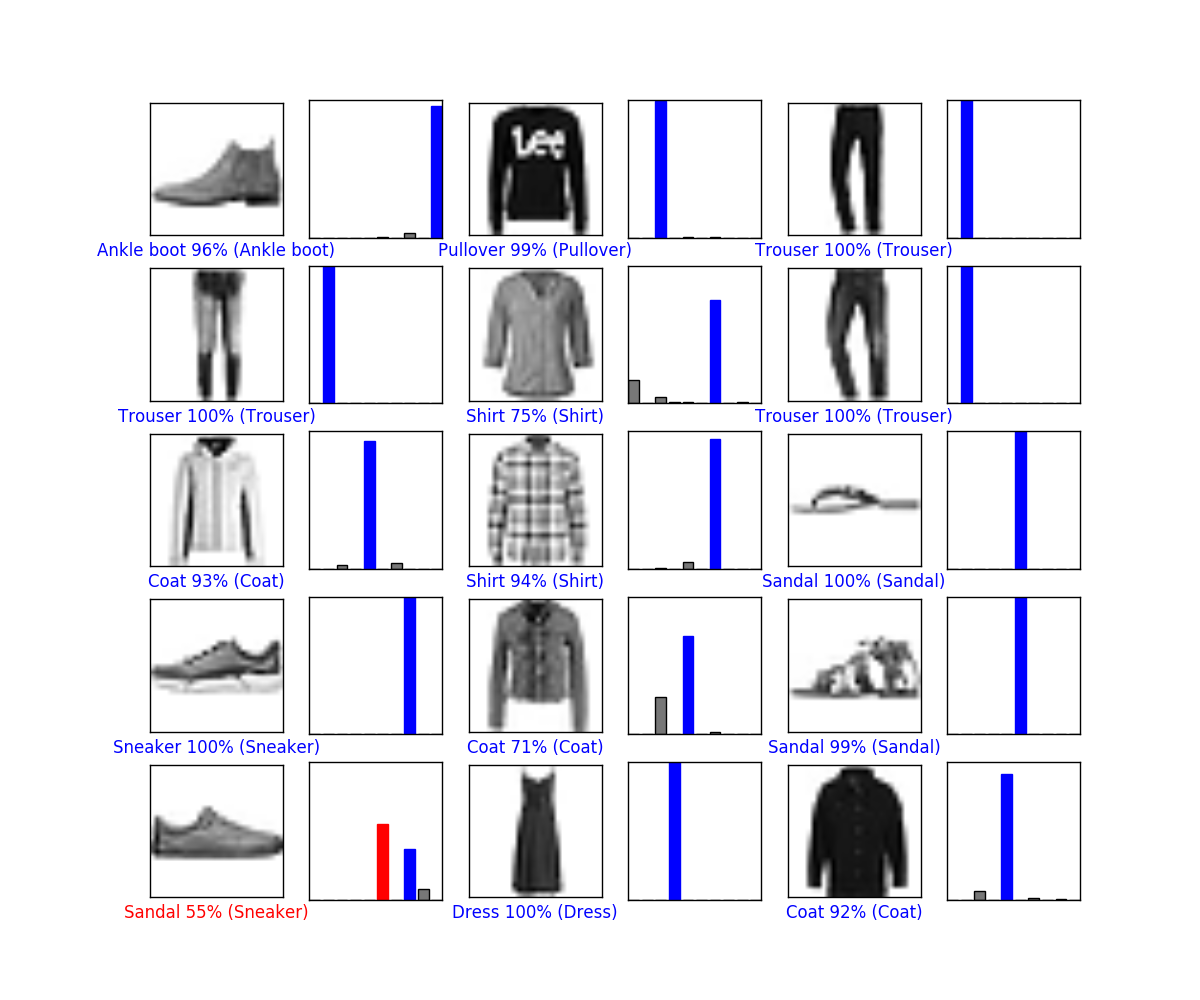
15個の画像を取り出して分類結果を確認する.

うーん.それはサンダルではない... 他は概ね高い確率で正解.
おわりに
とりあえずMLの流れは概ね把握できた. 長いので一旦ここまでにする.

